Agenda
1. Use Case
Healthcare Revenue Cycle Management
2. Lakehouse Data Model
Bronze - Silver - Gold Medallion
3. Business Glossary
Domain terminology and definitions
4. Data Quality
Checks, tests, and validations
5. Lineage & Observability
Data flow tracking and monitoring
6. Pipeline Operations
Scheduler requirements
7. Business Reports
Patient invoices and EOB statements
8. Demo
Live walkthrough
Claimwise - The Data Story
Meet Claimwise, a fictitious healthcare company embracing data transformation. Data flows through: Patient Management System (MSSQL) – clinical interactions and Claims Processing System (Oracle) – financial transactions for Revenue Cycle Management.
Patient Mgmt
MSSQL
S3 Landing
CSV Extracts
Claims Proc
Oracle
Source Systems (OLTP) - Extract and Load
Lakehouse Data Pipeline (OLAP) - Transformation
The Fictitious RCM Demo Datasets
Synthetically created with referential integrity
Users
Patients, Doctors, Staff, Payers
Clinical Events
Encounters, Procedures, Activities
Financial
Claims, Collections, Health Plans
Lakehouse - Bronze Layer
- CSV files stored in S3 buckets
- Optional external tables can reference CSV files without moving data
- Tables can be created for selected subsets of interest
Complete Patient Financial Journey
Tracks the complete revenue cycle from patient registration through final payment collection.
Silver Layer - Staging Models
Base tables materialized as views against bronze data
One-to-One Mapping
Each source table → corresponding staging model (views)
Minimal Transformations
Column renaming, type casting, date standardization
Silver Layer - Intermediate Persona Views
Purpose-built transformations organized by user personas
Persona-Based Views
- Single user entity split into focused persona views
- Business rules applied through view definitions
- Aggregated computations for downstream analysis
Data Quality Enforced
- Uniqueness and not_null constraints
- Referential integrity with staging tables
- Accepted_values and custom validations
Gold Layer - Star Schema
Kimball Dimensional Modelling with 8 dimensions and 3 fact tables
dim_facility
dim_date
dim_health_plan
dim_patient
fct_encounters
fct_claims
fct_collections
dim_payer
dim_doctor
dim_department
dim_diagnosis
Business Glossary
Domain terminology linked to technical metadata
Metadata Integration
All business terms are linked to technical metadata for complete traceability and governance.
Data Quality Checks & Validations
Comprehensive validation framework across data layers
Daily Validation
- Uniqueness constraints
- Format validations
- Code validations
- Not-null checks
Weekly Checks
- Provider-service matching
- Payment reconciliation
- Documentation completeness
- Cross-reference validation
Monthly Audits
- Compliance review
- Pattern analysis
- Outlier detection
- Trend monitoring
Quality Objectives
Identify Issues
Data quality problems
Validate Rules
Business logic
Ensure Integrity
Referential checks
Monitor Compliance
Process standards
Data Lineage & Observability
End-to-end visibility from source to exposure
Impact Analysis
Understand downstream effects
Root Cause
Trace issues to source
Compliance
Audit trail for regulations
Unity Catalog Lineage - Live from Databricks
Captured from the production run - Databricks records lineage automatically from the SQL, no configuration needed
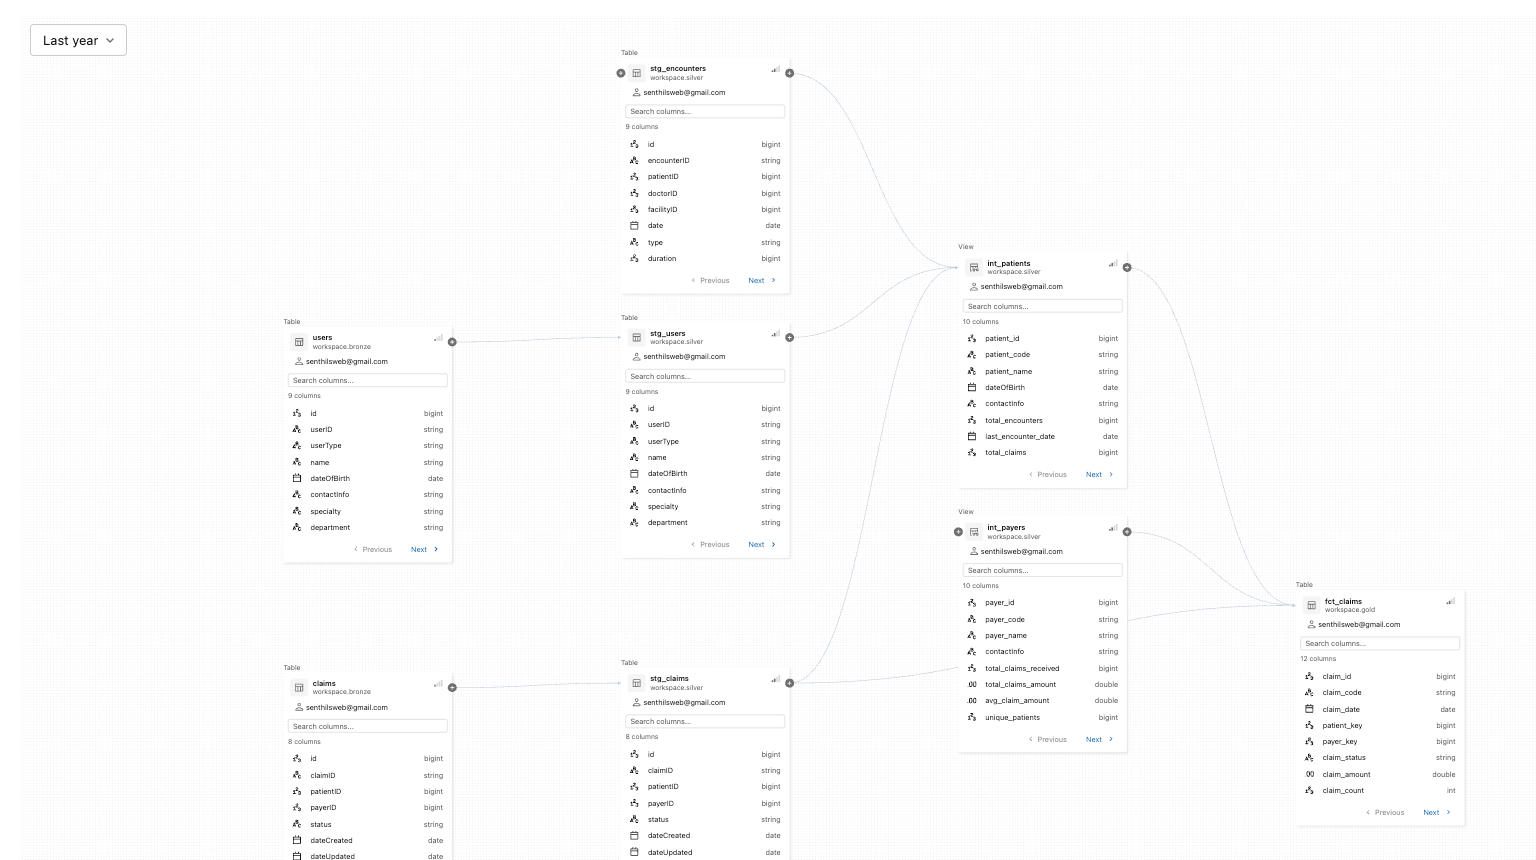
Table lineage - bronze.claims and bronze.users flow through silver staging and intermediate views into gold.fct_claims
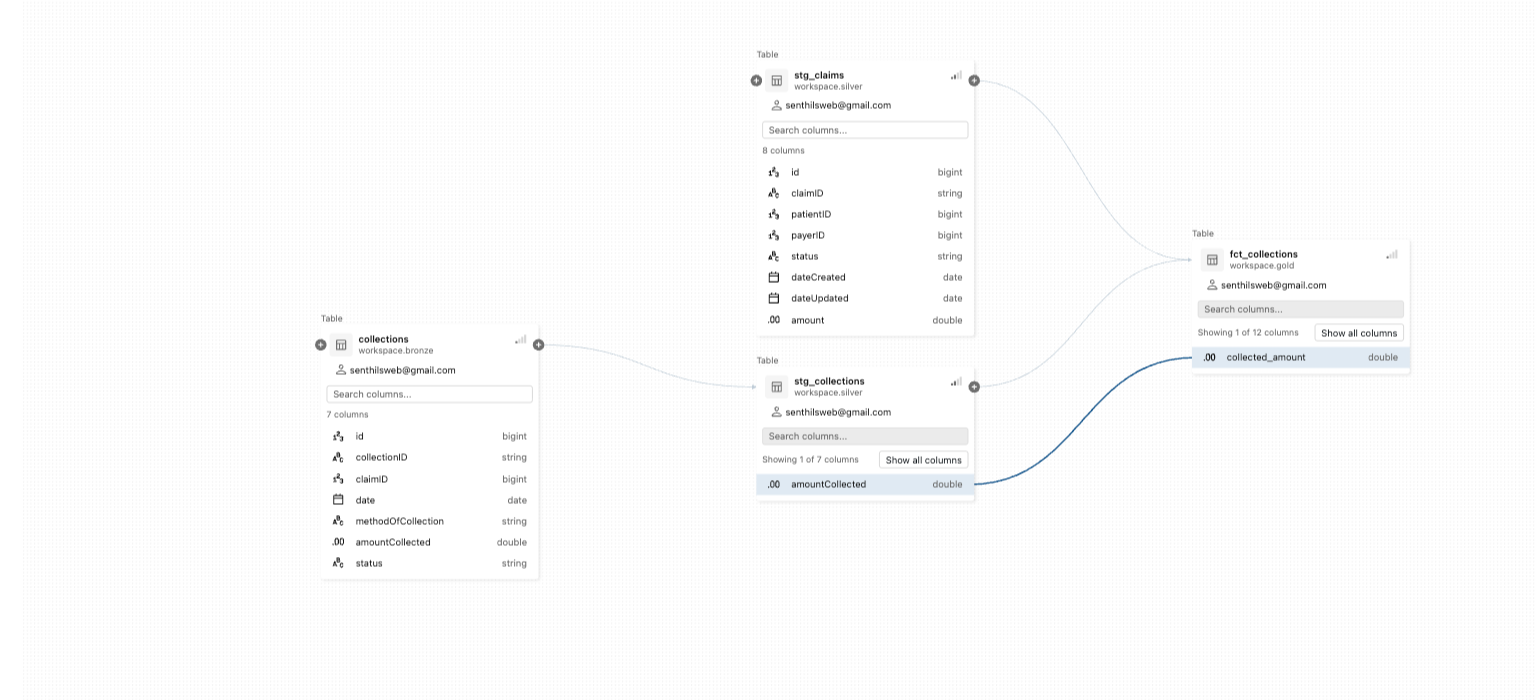
Column lineage - bronze.collections.amountCollected traced field-by-field to gold.fct_collections.collected_amount
Every dbt run refreshes this graph - impact analysis and root-cause tracing come free with the platform
Claimwise Revenue Pulse - Live Dashboard
Databricks AI/BI dashboard, deployed as code (make dashboard) - every widget reads the gold metric layer
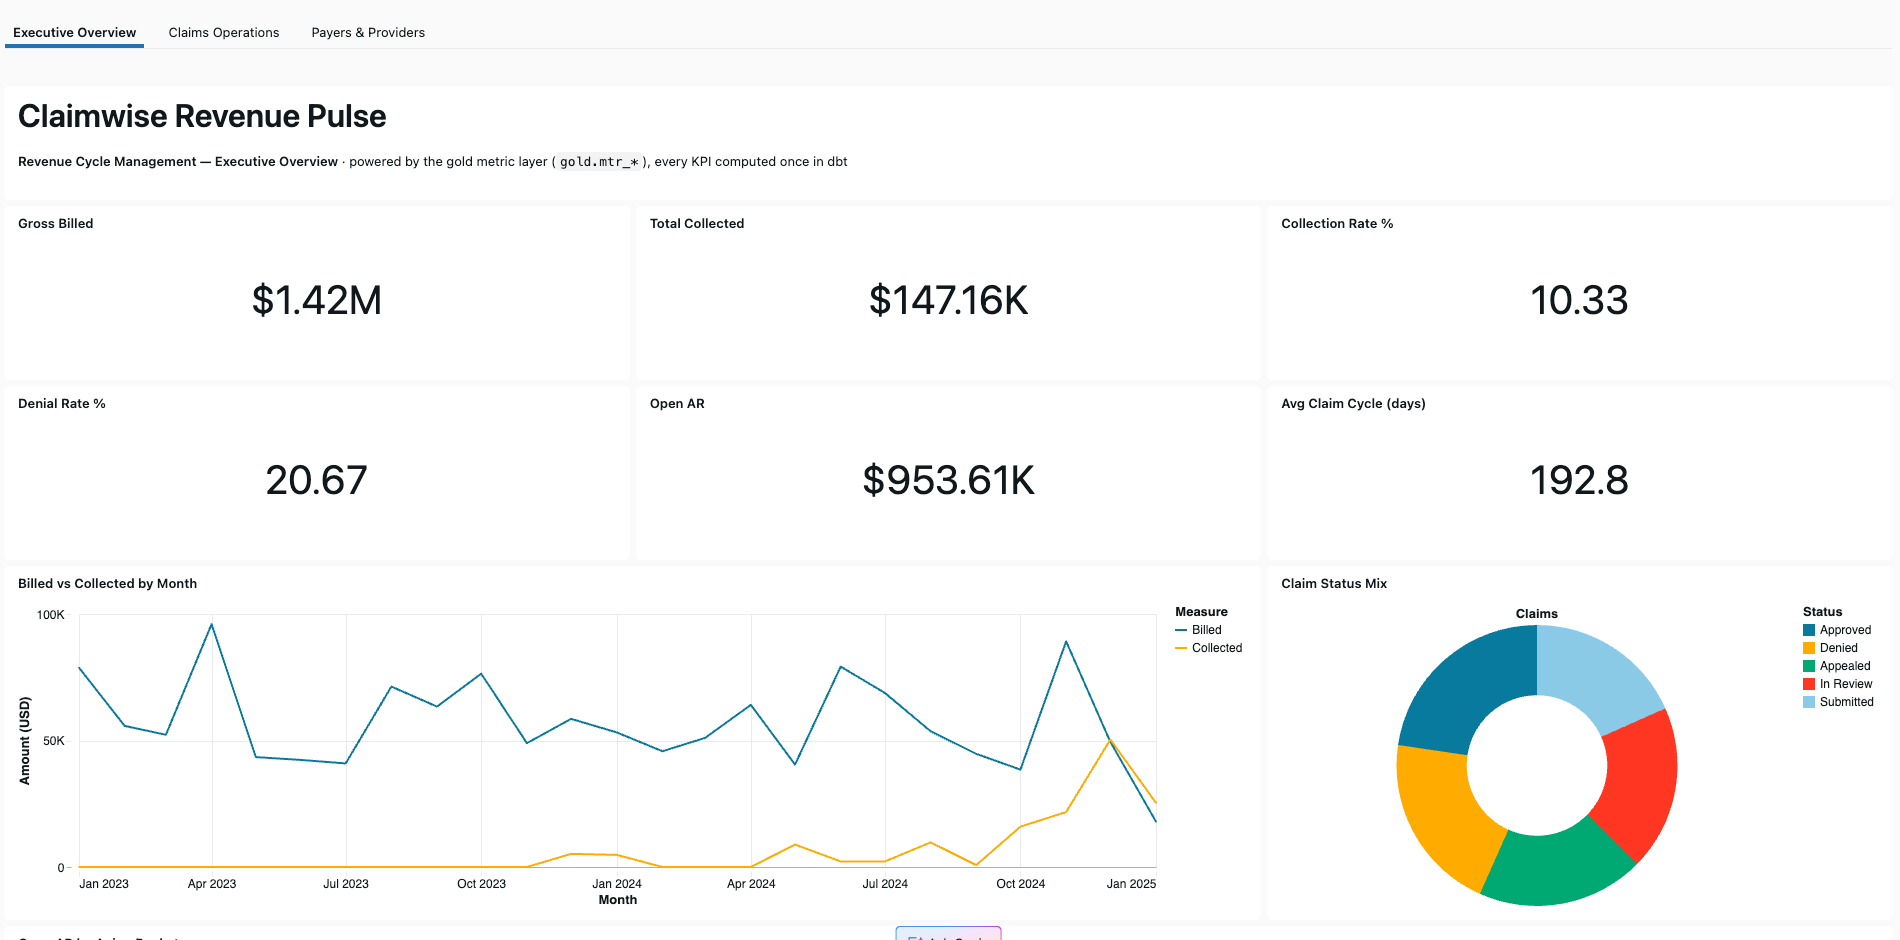
Executive Overview - KPI cards, billed vs collected trend, claim status mix, AR aging
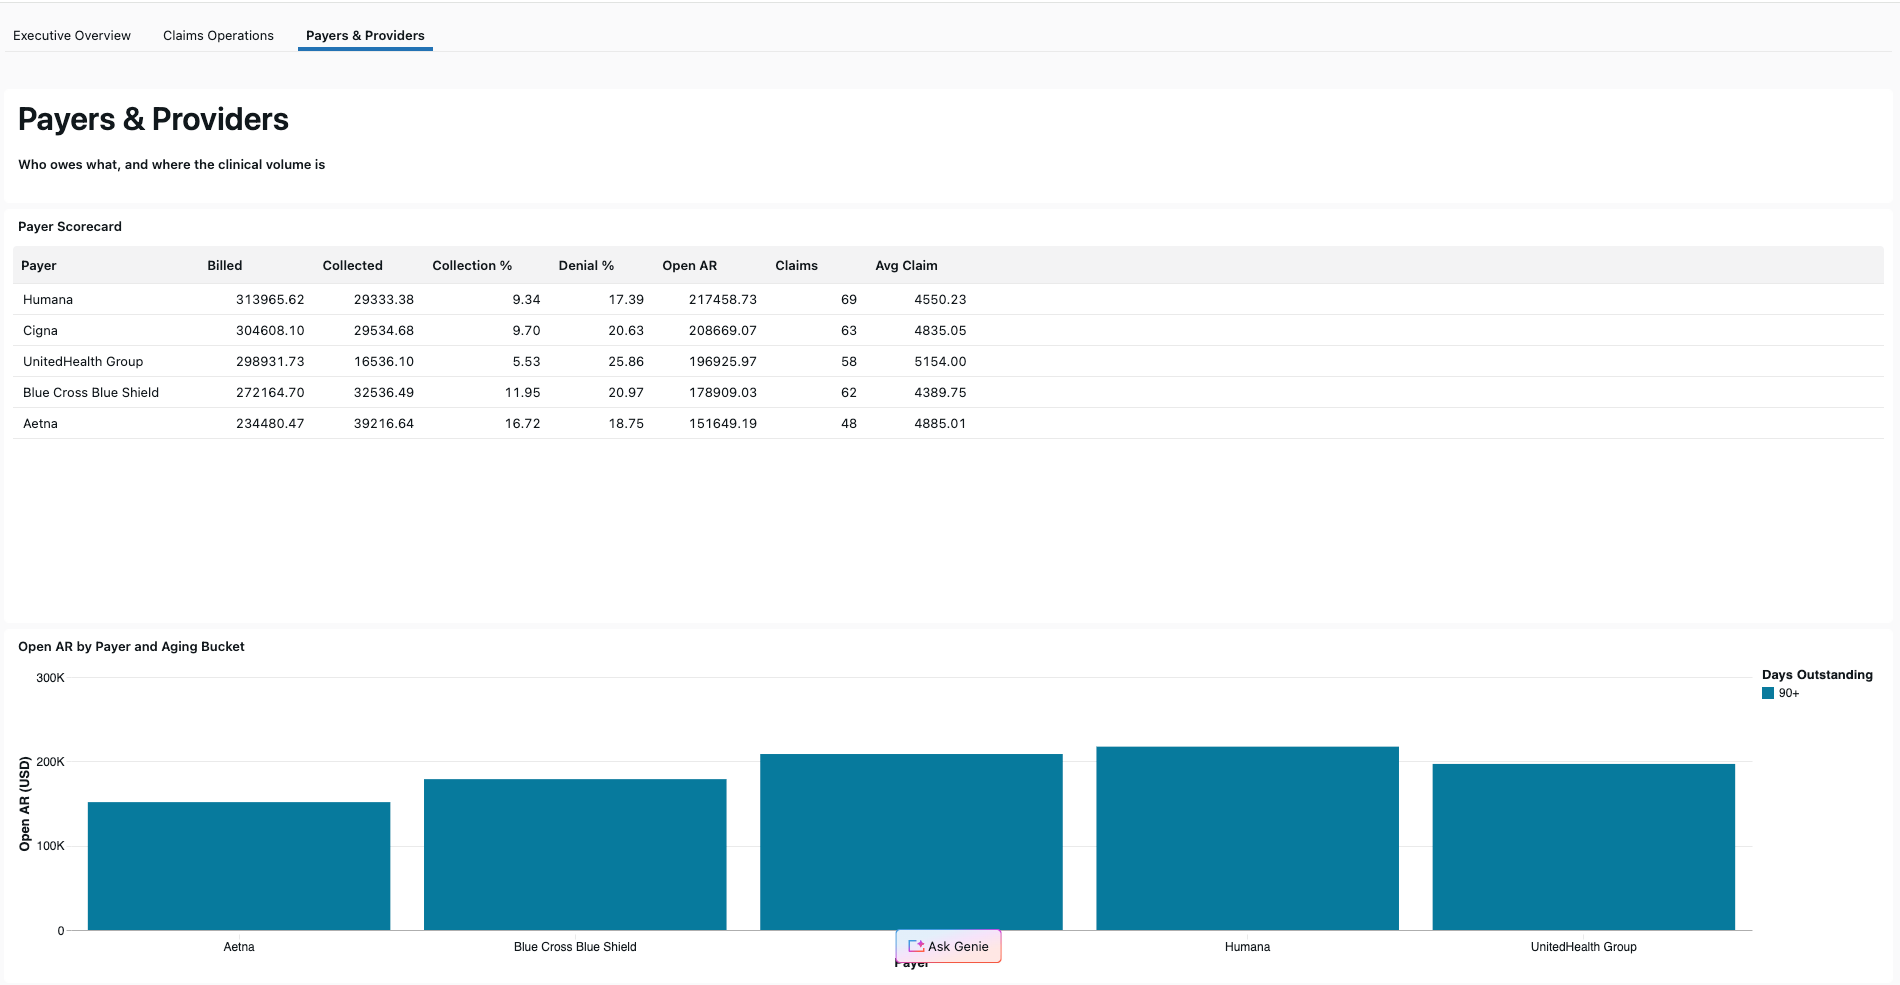
Payers & Providers - scorecard and open AR by payer
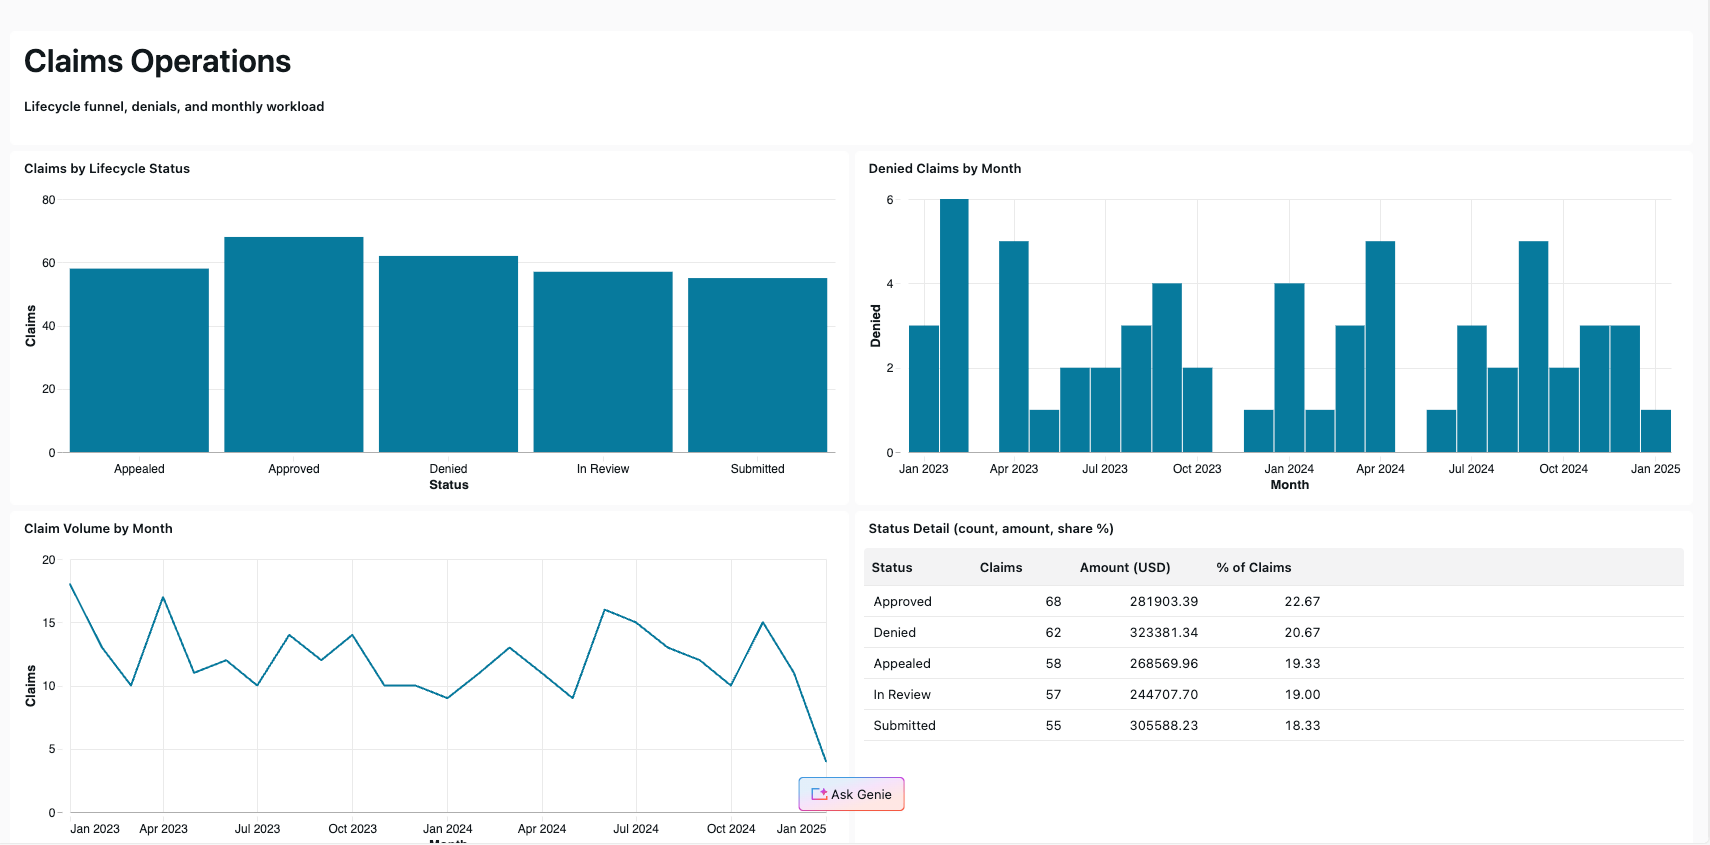
Claims Operations - funnel, denials, volume, and status detail
Metric Layer - One Definition, Every Consumer
KPI math lives in gold metric models (gold.mtr_*) plus a Unity Catalog metric view - consumers only select, never recompute
Gold Facts
fct_claims, fct_collections, fct_encounters
Metric Layer
6 mtr_* dbt models + UC metric view claimwise_metrics
collection rate · denial rate · open AR · aging · cycle days
Consumers
Dashboard · Genie · ad-hoc SQL
Consistency: every KPI is computed once in the metric layer, so the dashboard, Genie, and ad-hoc SQL can never disagree on a number.
Change once, ship everywhere: metrics are version-controlled, tested dbt models - update a definition in one file and every consumer follows, with no per-report rework.
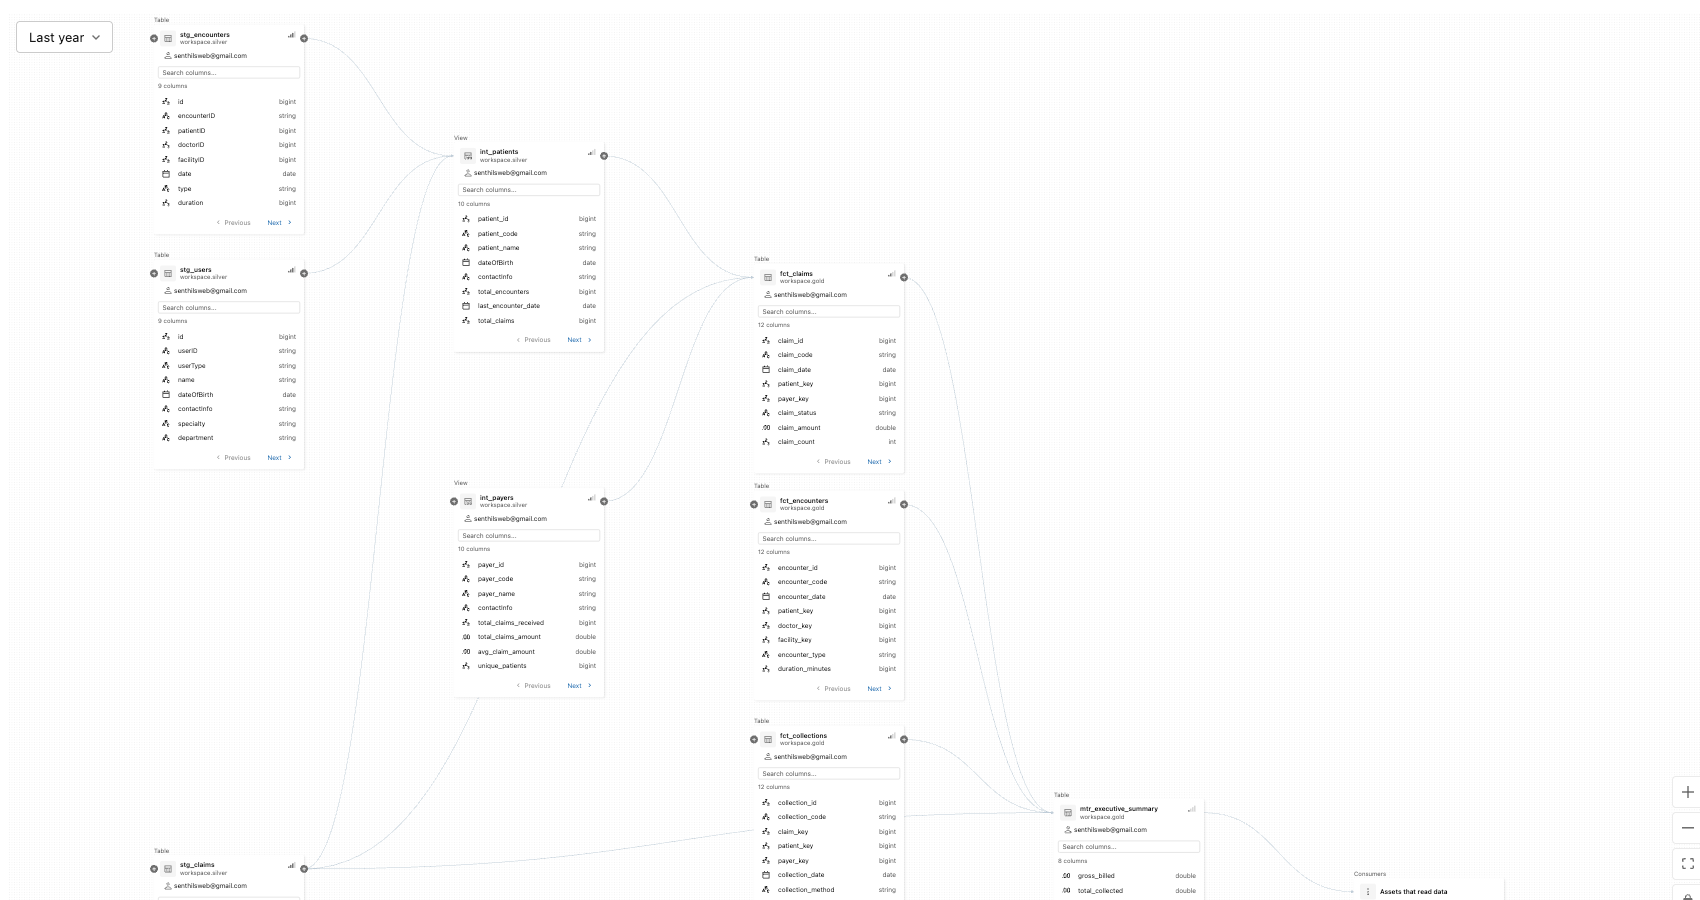
Real end-to-end lineage - silver → gold facts → mtr_executive_summary → dashboard (assets that read data)
Pipeline Scheduler Requirements
Orchestration and monitoring for data pipelines
Pipeline #1 - Extract & Load
- Schedule: Every 2 hours
- Blockout: Sunday 2-4 AM (Maintenance)
- Failure: Retry once after 15 min, max 2 times
- Alerts: Notifications for each failure
- Observability: Emit OpenLineage events
Pipeline #2 - Transform
- Trigger: Depends on Pipeline 1 completion
- Alternative: Execute every 4 hours if P1 doesn't run
- Freshness: Skip if data is stale
- Logging: Detailed logs for reporting
- Observability: Centralized log stack
Pipeline Components
Business Reports - EOB Statement
Explanation of Benefits - Multi-page statement for patients
Explanation of Benefits (EOB) Statement
$5,081.71
$4,319.45
$762.26
If you disagree with this decision, you may appeal within 30 days.
Your plan includes cost-sharing features like deductibles, copayments, and coinsurance. These determine your out-of-pocket costs for covered services.
The amount you pay before your health plan begins to pay.
A fixed amount you pay for covered services.
Dynamic Multi-Page Report
Member info, claim summary, deductible progress, service details.
Distribution
Generated reports partitioned by type and date, delivered via SMTP.
Claimwise Synthetic Data Generator
Configurable synthetic data for demos, testing, and development
Configurable Volume Controls
- Patients: 50 - 2,000 records
- Doctors: 5 - 100 providers
- Facilities: 2 - 50 locations
- Encounters: 100 - 5,000 visits
- Claims: 100 - 7,500 claims
- Date Range: Custom start/end dates
Multiple Interfaces
- Marimo Notebook: Interactive UI with sliders
- CLI Module: Command-line for automation
- Docker: Containerized execution
- Output Formats: CSV, Parquet, JSON
- Reproducible: Seed parameter for consistency
- Realistic: Faker library integration
Quick Start Commands
$ marimo run rcm_generator.py
$ python rcm_module.py --format duckdb --patients 500 --claims 1500
$ python rcm_module.py --patients 500 --claims 1500 --format parquet
$ docker-compose up generate-large
Generated Data Model
7 interrelated datasets with referential integrity
Patients, Doctors, Staff
Hospitals, Clinics
Insurance Plans
Patient Visits
Medical Claims
Lifecycle Events
Payments Received
Demo
50 patients, 100 claims
~1,500 records
Small
100 patients, 300 claims
~3,000 records
Medium
500 patients, 1,500 claims
~15,000 records
Large
2,000 patients, 7,500 claims
~75,000 records
Realistic Data Quality
Valid NPI numbers, ICD-10/CPT codes, realistic names and addresses via Faker.
Full RCM Lifecycle
Patient → Encounter → Claim → Activities → Collection. Complete revenue cycle.
Key Takeaways
Healthcare RCM Analytics with Modern Data Lakehouse
Unified Data Model
Bronze - Silver - Gold Medallion
Data Quality
Comprehensive validation at every layer
Full Lineage
End-to-end traceability with OpenLineage
Business Glossary
Domain terminology linked to metadata
Operational Excellence
Scheduled pipelines with monitoring
Business Intelligence
Reports and dashboards for stakeholders
Modern Data Architecture for Healthcare
From source systems to actionable insights - a complete data story